Viewer Insights
Easily monitor and analyze viewer behavior of your live stream
Curious about who's watching your live stream in real time—and where they're located? Want to track when viewers join or leave your stream? These are just a few of the valuable viewer insights you can access to better understand audience behavior and optimize future streams.THEOlive provides detailed viewer insights for every user.
This guide explains the types of viewer insights available for your THEOlive channel and shows you where to find them in the platform.
How to access viewer insights
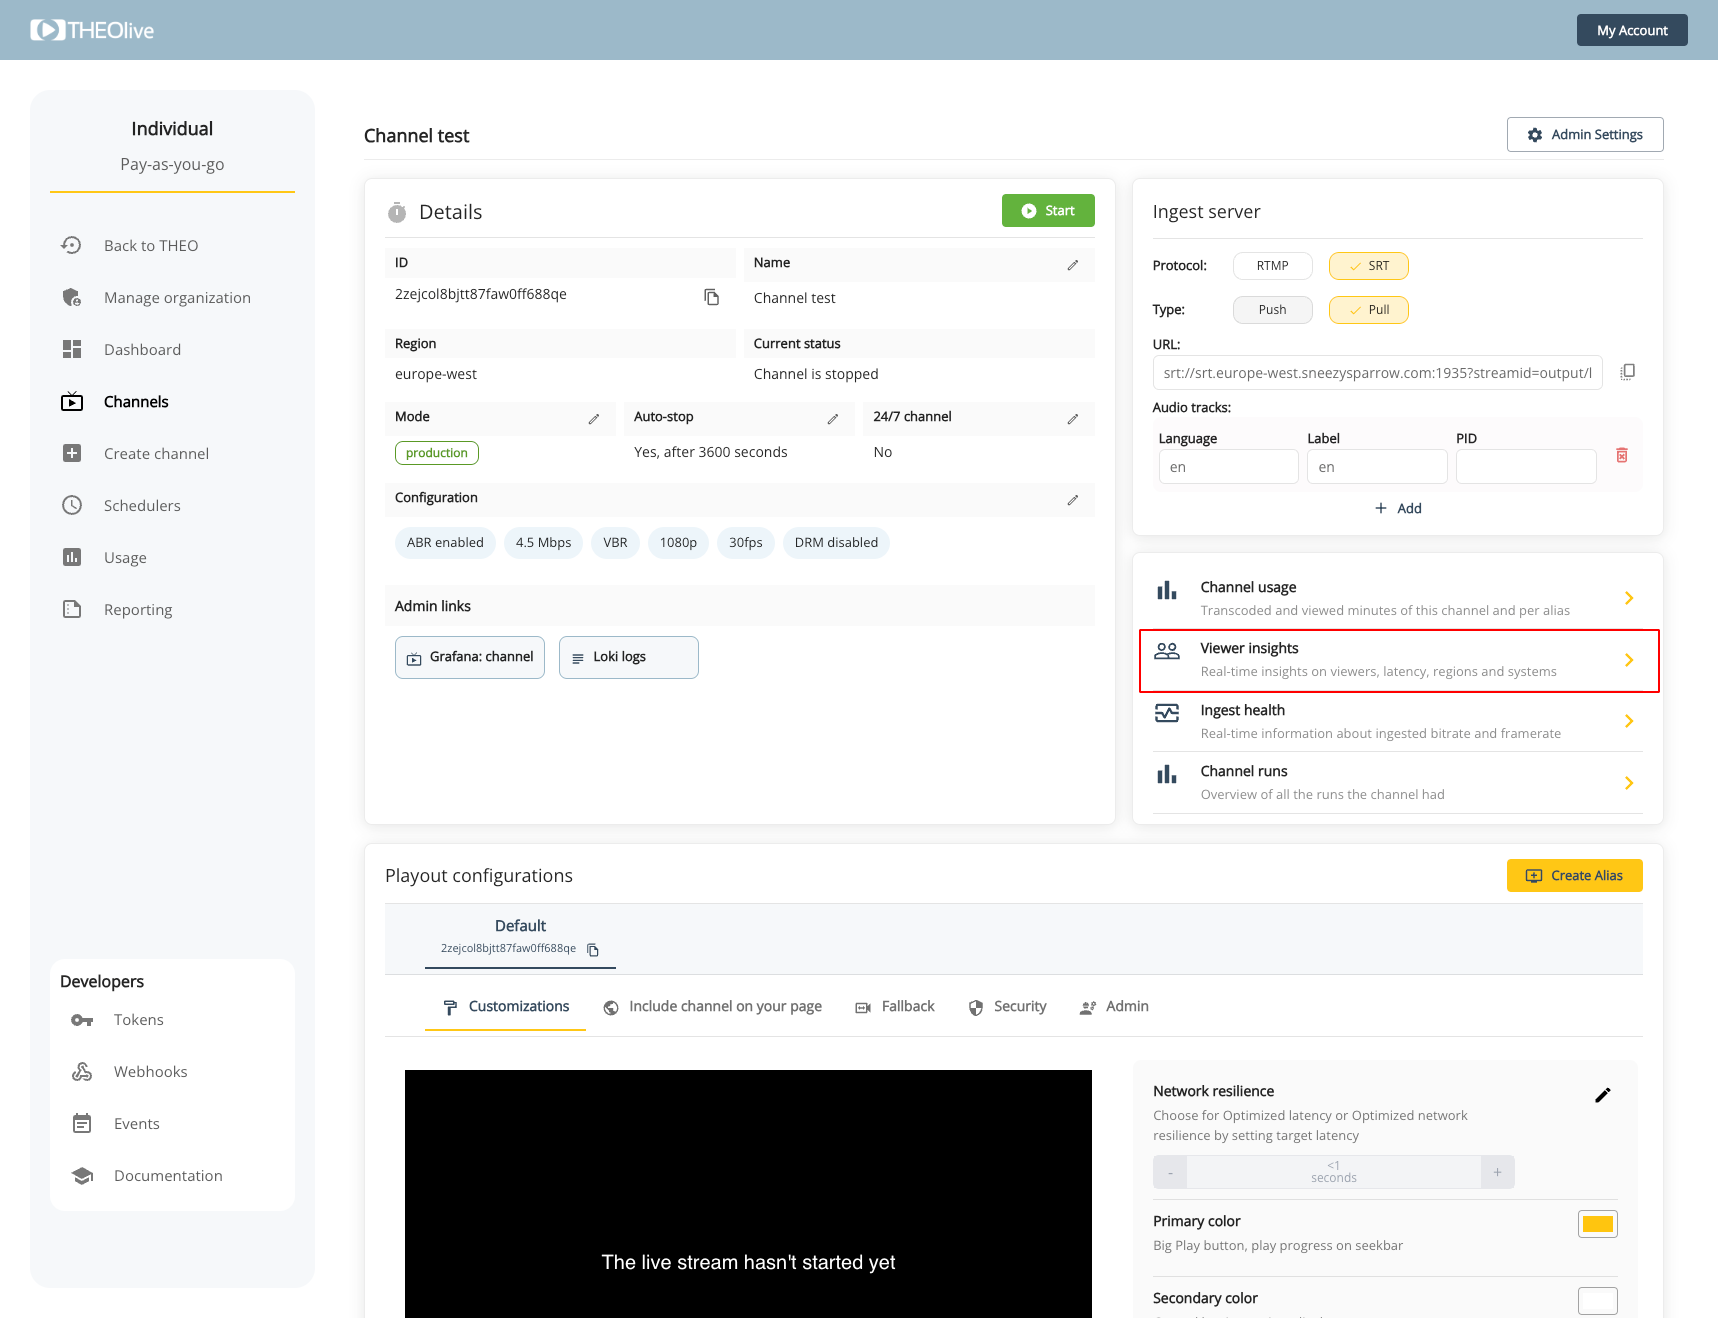
Viewer insights are available for each channel and can be accessed from your channel page. To view them, go to the Details tab and click on Viewer Insights. The screenshot below highlights where to find this option.
Each channel has its own dedicated viewer insights page. If you're running multiple channels at the same time (including any failover channels), you'll need to repeat this process for each one individually.
Analyzing viewer insights
The viewer insights page of your channel includes:
- Main channel information
- Viewer sessions
- Viewer latency
- Viewer locations
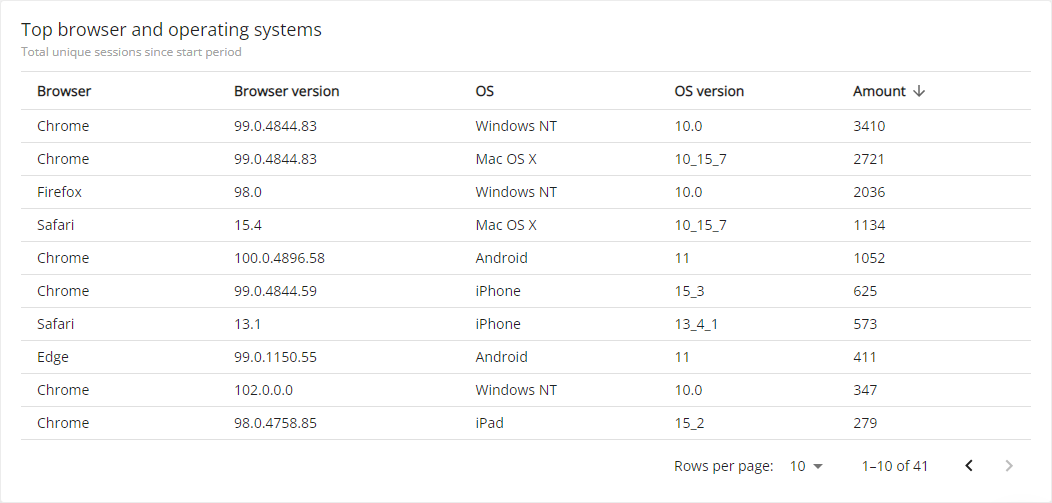
- Top browser and operating systems
Viewer insights will only work if you are using THEOlive inside a THEOplayer. Please refer to this guide for implementation details.
Main channel information
The top section displays key information about your channel, including the channel ID, channel name, and current status. This helps you confirm that you're viewing the correct channel data and whether the stream is currently live.
At the bottom of this section, you’ll find a selector to choose the period for the viewer insights graphs. You can choose from several time periods—ranging from Last hour to Last 30 days. The data shown in the sections below will adjust based on the selected time range.
Viewer sessions
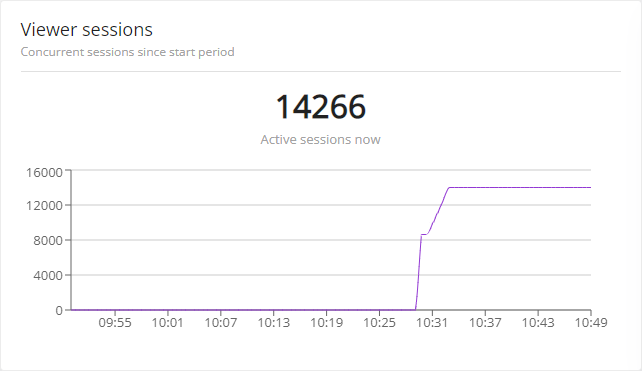
This graph displays the number of concurrent viewer sessions during the selected time period. It also highlights the current number of active sessions, giving you real-time insight into how many viewers are watching your live stream at any given moment.
Viewer latency
When interactivity matters, ultra-low latency is crucial.
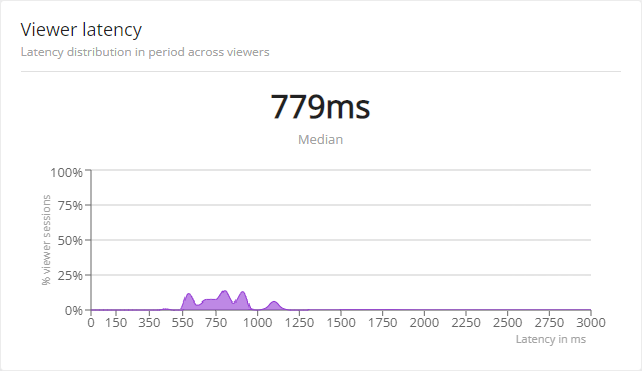
The next graph displays the viewer latency over the selected time period, showing the percentage of viewers who experienced a specific median latency value. For example, the graph may indicate that most viewers had a latency between 550ms and 950ms, with an overall median latency of 834ms. This helps you assess how closely your stream approaches real-time delivery.
Viewer locations
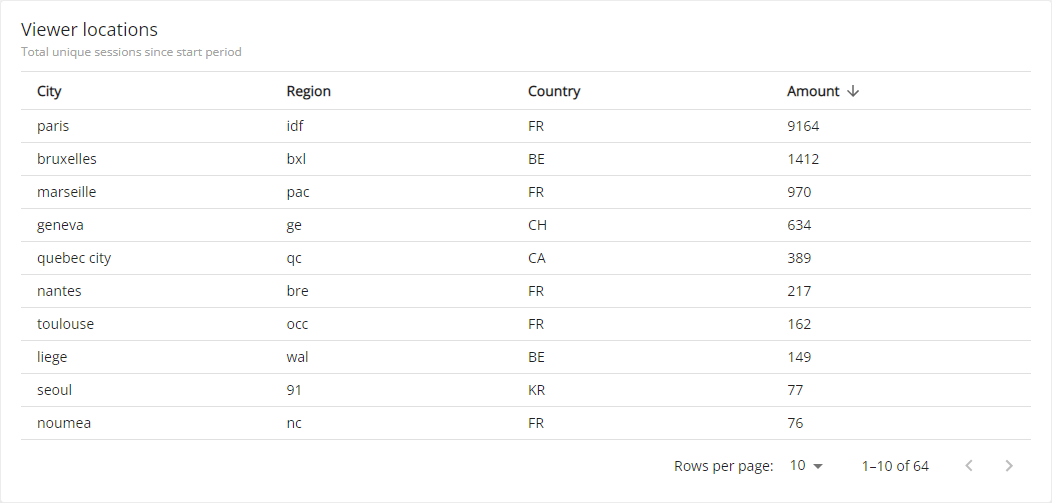
Want to know where your viewers are tuning in from? The next table displays the geographic distribution of your viewers, showing the cities or locations they connected from and the number of connections per location.
You can sort the table by any column (in ascending or descending order) and adjust the number of rows displayed per page to better explore the data.
Top browser and operating systems
Curious about how your viewers are watching your stream—on mobile, desktop, or other platforms?
The final table on the Viewer Insights page breaks down viewership by browser, browser version, operating system, and OS version. This helps you understand what devices and environments your audience is using.
You can sort the table by browser, operating system, or session count (ascending or descending), and adjust the number of rows displayed per page to suit your needs.
